Improving Guest Experience Consistency at Live Events Through Root Cause Analysis
Introduction
This report is prepared for the operations and event planning leadership team at Summit Curations and its hospitality venue partners. As the company continues to expand its event offerings, including weekly trivia nights, karaoke, music bingo, and private venue booking, satisfaction has become a top priority. However, one challenge that continues to affect retention and brand reputation is inconsistent guest experience.
Guests often attend events with high expectations set by previous positive encounters. When subsequent events fall short—due to delays, confusion, or technical issues, it not only affects their willingness to return but also shapes the word-of-mouth narratives they share with others. This inconsistency is particularly damaging in a local, relationship-driven business model where personal recommendations and repeat visits are vital to growth.
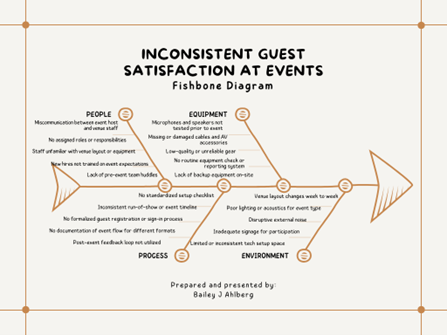
To address this issue, I have selected the Fishbone Diagram as the primary research tool. Its structure allows for visualizing multiple contributing factors to a single outcome, which is essential in a multi-touchpoint environment, such as live events. The tool helps break down complex systems into manageable, observable causes, enabling us to pinpoint patterns and design practical solutions supported by real data.
Impact on Customer Experience
Inconsistencies in event execution diminish the credibility and value of the Summit Curations brand. When guests experience seamless registration, engaging content, and professional facilitation for one week, but face delays, disorganized hosts, or equipment failures the next, they begin to lose trust. This creates uncertainty around what to expect, and in hospitality, consistency is often more valuable than one-off excellence.
Several indicators point to the adverse effects:
Guest comment cards and social media reviews cite confusion about start times, unclear instructions for games, and poor audio quality.
Attendance drops significantly after events where logistical issues occurred.
Bar sales, which correlate directly to guest engagement and dwell time, decrease when events start late or feel unorganized.
For a service model that thrives on energy, engagement, and entertainment, these missteps can make or break brand loyalty. Inconsistent delivery also affects employee morale and venue partner satisfaction, creating further challenges in coordination and growth.
Recommended Improvement Initiative
Through the use of the Fishbone Diagram, we have identified key contributors to this problem across several categories:
People: Inconsistent communication between the host and venue staff
Process: No formal checklist or documented SOP for recurring event setup
Equipment: Frequent AV or microphone issues that go unresolved between events
Environment: Each venue layout varies, but the setup expectations are not adapted accordingly
To solve this, I propose implementing a Standardized Event Operations Protocol, which includes the following components:
A pre-event checklist tailored to each venue, including equipment, signage, and registration materials.
Weekly Equipment Log, where hosts note malfunctions or missing supplies and submit maintenance requests.
Pre-Shift Communication Huddles with venue managers or bartenders to align timing, roles, and any updates.
Defined Staff Roles, such as one person handling registration and another managing music or visual components.
Follow-up Documentation, including a brief report on what went well and what needs improvement for next time.
This initiative focuses not only on addressing recurring issues but also on creating a replicable structure that ensures smoother operations across all events.
Metrics to Track
To assess whether these improvements are working, we will track the following data points:
Guest Satisfaction Ratings collected via digital surveys with Likert-scale and open-ended questions
Incidents of Technical Issues logged in post-event reports
Staff Feedback Forms with fields to evaluate communication, equipment reliability, and workflow clarity
Bar Revenue by Event Night, comparing periods before and after SOP implementation
Return Attendance Rates, using registration logs to measure repeat participation
Tracking these metrics over a 4–to 6-week period will help establish whether the protocol has improved both the guest experience and operational efficiency.
References
Bagdan, P. J. (2019). Guest service in the hospitality industry (2nd ed.). Kendall Hunt Publishing Company.